
North Kona Real Estate Market Update: October 2026- Lower median prices and a stronger month for condos

 If you’ve been trying to figure out what the Kona real estate market is doing, October gives us plenty to talk about. Single-family home sales were nearly unchanged from a year ago. Condo sales picked up. Yet year-to-date median prices are lower for both property types, and buyers have a substantial selection of properties to consider.
For this West Hawaiʻi market update, we’re focusing on North Kona. The numbers show why it helps to look beyond any single headline—and why the property you’re buying or selling matters more than a broad market label.
North Kona single-family homes: steady sales, lower median prices
People are still buying homes in North Kona. October finished just one sale behind last year, and year-to-date closings are actually six sales ahead of 2025.
The change is in the prices of the homes closing. October’s median was $271,000 below last October’s. Looking at the broader January-through-October period, the median declined $92,500, or 7.3%.
That does not mean every Kona home has lost 20.5% of its value. The median is the middle sale price, and it changes with the mix of homes sold. More sales at lower price points can bring it down, even when individual properties have had very different experiences.
For October 2026, the reported sale-to-original-list-price ratio for single-family homes was 97.2%. That represents a 2.8% gap below original asking prices on this measure. It’s useful context, but it doesn’t mean every seller negotiated the same discount or that every active listing will sell that close to asking.
Condos: an encouraging October, with a softer year overall
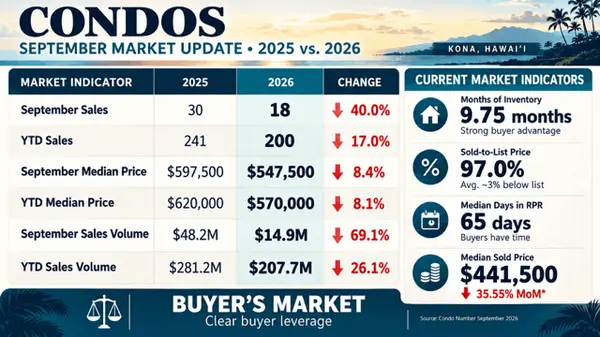
Condo sales were a bright spot in October. Twenty-four closed, compared with 19 a year earlier, while the median held at $550,000.
But one good month doesn’t erase the rest of the year. Through October, condo closings remained 36 below 2025, and the year-to-date median was $50,000 lower. We’re encouraged by October’s activity, while watching to see whether that improvement continues.
What buyers are seeing on the market now
Our current inventory snapshot adds another layer:
These inventory estimates divide current active listings by October’s closings. They describe how long that supply would take to sell at the same pace, assuming no new listings. They are a snapshot, rather than a forecast, and depend on consistent listing classifications.
The single-family figures suggest a market near balance, while condos show conditions more favorable to buyers. The opportunity still varies by location, price, condition, and ownership type.
The active-listing days on market are especially useful: half of the available homes had already been listed for at least 86 days, and half of the condos for at least 93 days. Those properties are still waiting for a sale.
In our separate review of selected single-family closings, October 2026 showed a 14-day median and a 38-day average days on market. This selected group is not the complete MLS sales population, so we’re treating it as context rather than a headline market statistic. It does illustrate how some properties can find buyers quickly while others remain available much longer.
Price reductions show sellers are responding
During the past week reviewed, North Kona recorded 37 price reductions, 16 new listings, and seven closed sales, combining single-family homes and condos.
That’s considerable pricing activity in a short period. It tells us sellers are reassessing asking prices as they compete for attention. This weekly snapshot is separate from October’s monthly totals; new listings and closings also represent different transaction timelines.
Why luxury sales need their own context
October’s single-family dollar sales volume fell 50.4%, from approximately $94.8 million to $47 million. But two $22 million sales accounted for nearly half of last October’s total. This October included three sales totaling $14.75 million at $4.4 million, $5 million, and $5.35 million.
Those transactions matter, but they can make a dollar-volume headline feel far removed from someone shopping for a typical Kona home. Condo dollar volume went the opposite direction, rising 107.5% in October, even as its monthly median stayed flat. Year-to-date condo dollar volume was still down 21.3%.
That’s why we look at sales counts, median prices, available inventory, and individual comparable properties together.
What this means for your next move
For buyers, there are choices and potential negotiating opportunities, particularly in condos and properties that have been sitting. That doesn’t guarantee a large discount on every listing.
For sellers, price, condition, and location still matter. Recent comparable sales and competing listings are a better starting point than an island-wide headline or last year’s expectations.
Thinking about buying or selling in Kona? Connect with the 365Hawaii Group at Real Broker through 365HawaiiRE.com. We’ll help you understand how these numbers apply to your neighborhood, condo complex, and plans.
Source: Local MLS overall figures supplied for North Kona. Year-to-date figures cover January–October. Current inventory and the weekly activity snapshot were gathered after October and do not represent October month-end inventory. Selected-property observations are identified separately; exclusions were not applied to the headline MLS tables. Median price changes reflect the properties sold and do not measure appreciation or depreciation of an individual property.
Categories
Recent Posts